Bjorgum Double Tap█ OVERVIEW
Double Tap is a pattern recognition script aimed at detecting Double Tops and Double Bottoms. Double Tap can be applied to the broker emulator to observe historical results, run as a trading bot for live trade alerts in real time with entry signals, take profit, and stop orders, or to simply detect patterns.
█ CONCEPTS
How Is A Pattern Defined?
Doubles are technical formations that are both reversal patterns and breakout patterns. These formations typically have a distinctive “M” or a “W” shape with price action breaking beyond the neckline formed by the center of the pattern. They can be recognized when a pivot fails to break when tested for a second time and the retracement that follows breaks beyond the key level opposite. This can trap entrants that were playing in the direction of the prior trend. Entries are made on the breakout with a target projected beyond the neckline equal to the height of the pattern.
Pattern Recognition
Patterns are recognized through the use of zig-zag; a method of filtering price action by connecting swing highs and lows in an alternating fashion to establish trend, support and resistance, or derive shapes from price action. The script looks for the highest or lowest point in a given number of bars and updates a list with the values as they form. If the levels are exceeded, the values are updated. If the direction changes and a new significant point is made, a new point is added to the list and the process starts again. Meanwhile, we scan the list of values looking for the distinctive shape to form as previously described.
█ STRATEGY RESULTS
Back Testing
Historical back testing is the most common method to test a strategy due in part to the general ease of gathering quick results. The underlying theory is that any strategy that worked well in the past is likely to work well in the future, and conversely, any strategy that performed poorly in the past is likely to perform poorly in the future. It is easy to poke holes in this theory, however, as for one to accept it as gospel, one would have to assume that future results will match what has come to pass. The randomness of markets may see to it otherwise, so it is important to scrutinize results. Some commonly used methods are to compare to other markets or benchmarks, perform statistical analysis on the results over many iterations and on differing datasets, walk-forward testing, out-of-sample analysis, or a variety of other techniques. There are many ways to interpret the results, so it is important to do research and gain knowledge in the field prior to taking meaningful conclusions from them.
👉 In short, it would be naive to place trust in one good backtest and expect positive results to continue. For this reason, results have been omitted from this publication.
Repainting
Repainting is simply the difference in behaviour of a strategy in real time vs the results calculated on the historical dataset. The strategy, by default, will wait for confirmed signals and is thus designed to not repaint. Waiting for bar close for entires aligns results in the real time data feed to those calculated on historical bars, which contain far less data. By doing this we align the behaviour of the strategy on the 2 data types, which brings significance to the calculated results. To override this behaviour and introduce repainting one can select "Recalculate on every tick" from the properties tab. It is important to note that by doing this alerts may not align with results seen in the strategy tester when the chart is reloaded, and thus to do so is to forgo backtesting and restricts a strategy to forward testing only.
👉 It is possible to use this script as an indicator as opposed to a full strategy by disabling "Use Strategy" in the "Inputs" tab. Basic alerts for detection will be sent when patterns are detected as opposed to complex order syntax. For alerts mid-bar enable "Recalculate on every tick" , and for confirmed signals ensure it is disabled.
█ EXIT ORDERS
Limit and Stop Orders
By default, the strategy will place a stop loss at the invalidation point of the pattern. This point is beyond the pattern high in the case of Double Tops, or beneath the pattern low in the case of Double Bottoms. The target or take profit point is an equal-legs measurement, or 100% of the pattern height in the direction of the pattern bias. Both the stop and the limit level can be adjusted from the user menu as a percentage of the pattern height.
Trailing Stops
Optional from the menu is the implementation of an ATR based trailing stop. The trailing stop is designed to begin when the target projection is reached. From there, the script looks back a user-defined number of bars for the highest or lowest point +/- the ATR value. For tighter stops the user can look back a lesser number of bars, or decrease the ATR multiple. When using either Alertatron or Trading Connector, each change in the trail value will trigger an alert to update the stop order on the exchange to reflect the new trail price. This reduces latency and slippage that can occur when relying on alerts only as real exchange orders fill faster and remain in place in the event of a disruption in communication between your strategy and the exchange, which ensures a higher level of safety.
👉 It is important to note that in the case the trailing stop is enabled, limit orders are excluded from the exit criteria. Rather, the point in time that the limit value is exceeded is the point that the trail begins. As such, this method will exit by stop loss only.
█ ALERTS
Five Built-in 3rd Party Destinations
The following are five options for delivering alerts from Double Tap to live trade execution via third party API solutions or chat bots to share your trades on social media. These destinations can be selected from the input menu and alert syntax will automatically configure in alerts appropriately to manage trades.
Custom JSON
JSON, or JavaScript Object Notation, is a readable format for structuring data. It is used primarily to transmit data between a server and a web application. In regards to this script, this may be a custom intermediary web application designed to catch alerts and interface with an exchange API. The JSON message is a trade map for an application to read equipped with where its been, where its going, targets, stops, quantity; a full diagnostic of the current state and its previous state. A web application could be configured to follow the messages sent in this format and conduct trades in sync with alerts running on the TV server.
Below is an example of a rendered JSON alert:
{
"passphrase": "1234",
"time": "2022-05-01T17:50:05Z",
"ticker": "ETHUSDTPERP",
"plot": {
"stop_price": 2600.15,
"limit_price": 3100.45
},
"strategy": {
"position_size": 0.1,
"order_action": "buy",
"market_position": "long",
"market_position_size": 0,
"prev_market_position": "flat",
"prev_market_position_size": 0
}
}
Trading Connector
Trading Connector is a third party fully autonomous Chrome extension designed to catch alert webhooks from TradingView and interface with MT4/MT5 to execute live trades from your machine. Alerts to Trading Connector are simple; just select the destination from the input drop down menu, set your ticker in the "TC Ticker" box in the "Alert Strings" section and enter your URL in the alert window when configuring your alert.
Alertatron
Alertatron is an automated algo platform for cryptocurrency trading that is designed to automate your trading strategies. Although the platform is currently restricted to crypto, it offers a versatile interface with high flexibility syntax for complex market orders and conditions. To direct alerts to Alertatron, select the platform from the 3rd party drop down, configure your API key in the ”Alertatron Key” box and add your URL in the alert message box when making alerts.
3 Commas
3 Commas is an easy and quick to use click-and-go third party crypto API solution. Alerts are simple without overly complex syntax. Messages are simply pasted into alerts and executed as alerts are triggered. There are 4 boxes at the bottom of the "Inputs" tab where the appropriate messages to be placed. These messages can be copied from 3 Commas after the bots are set up and pasted directly into the settings menu. Remember to select 3 Commas as a destination from the third party drop down and place the appropriate URL in the alert message window.
Discord
Some may wish to share their trades with their friends in a Discord chat via webhook chat bot. Messages are configured to notify of the pattern type with targets and stop values. A bot can be configured through the integration menu in a Discord chat to which you have appropriate access. Select Discord from the 3rd party drop down menu and place your chat bot URL in the alert message window when configuring alerts.
👉 For further information regarding alert setup, refer to the platform specific instructions given by the chosen third party provider.
█ IMPORTANT NOTES
Setting Alerts
For alert messages to be properly delivered on order fills it is necessary to place the following placeholder in the alert message box when creating an alert.
{{strategy.order.alert_message}}
This placeholder will auto-populate the alert message with the appropriate syntax that is designated for the 3rd party selected in the user menu.
Order Sizing and Commissions
The values that are sent in alert messages are populated from live metrics calculated by the strategy. This means that the actual values in the "Properties" tab are used and must be set by the user. The initial capital, order size, commission, etc. are all used in the calculations, so it is important to set these prior to executing live trades. Be sure to set the commission to the values used by the exchange as well.
👉 It is important to understand that the calculations on the account size take place from the beginning of the price history of the strategy. This means that if historical results have inflated or depleted the account size from the beginning of trade history until now, the values sent in alerts will reflect the calculated size based on the inputs in the "Properties" tab. To start fresh, the user must set the date in the "Inputs" tab to the current date as to remove trades from the trade history. Failure to follow this instruction can result in an unexpected order size being sent in the alert.
█ FOR PINECODERS
• With the recent introduction of matrices in Pine, the script utilizes a matrix to track pivot points with the bars they occurred on, while tracking if that pivot has been traded against to prevent duplicate detections after a trade is exited.
• Alert messages are populated with placeholders ; capability that previously was only possible in alertcondition() , but has recently been extended to `strategy.*()` functions for use in the `alert_message` argument. This allows delivery of live trade values to populate in strategy alert messages.
• New arguments have been added to strategy.exit() , which allow differentiated messages to be sent based on whether the exit occurred at the stop or the limit. The new arguments used in this script are `alert_profit` and `alert_loss` to send messages to Discord
"swing high"に関するスクリプトを検索

MTF Stochastic Zones w/ Candle and Swing Hi/Lo IndicatorsMTF Stochastic Zones w/ Candle and Swing Hi/Lo Indicators by // © KaizenTraderB
This indicator will display the Stochastic RSI as color zones utilizing 3 Timeframes of your choice as well as key reversal candles:
Entry Timeframe StochRSI Crossovers and Long Wick Reversal Candles (Hammer and Hanging Man) and Engulfing Candles
That correlate with Swing Highs and Lows.
When the higher timeframe is bullish it will be green and when bullish, red.
When the middle timeframe is counter the higher, it will appear brownish.
The entry timeframe will print Candle Labels and Swing Highs and Lows at bullish and bearish Stochastic RSI crossovers when oversold and overbought, respectively,
In the direction of the higher timeframe directional bias when the middle timeframe is counter that direction to catch reversals in corrections.
(It also prints Bull/Bear StochRSI Crossovers that correlated with Swing Highs and Lows that are not Hammers, Hanging Men or Engulfing Candles.)
The options allow you to turn the zones, swing highs and lows, candle indicators and entry StochRSI Crossovers on and off, as well as which Timeframes you choose to view.
Entry - 1Hr, 15m, 5m or 1m Middle Timeframe - Daily, 4Hr, 1Hr or 15m Higher Timeframe - Monthly, Weekly, Daily, 4Hr or 1Hr
You can change the Swing High and Low Lookback periods, as well as
The Stochastic RSI Lookback for each of the three timeframes and the level of Overbought and Oversold:
When 8 is chosen for RSI Lookback, Stochastic Lookback = 5, SmoothK = 3, Smooth D = 3 For 13 - 8, 5, 5 For 21 - 13, 8, 8 For 34 - 21, 13, 13
Its good practice to adjust settings so Higher Timeframe zones (green/red) correlate with longer trend movements,
Medium Timeframe with corrections and reversal areas (brown) and Entry Timeframe with key reversal candles.
For example, to adjust the Daily Higher Timeframe, turn the Higher Timeframe to Daily, turn off the others and bring up the Daily Chart.
Look at chart for last 200 bars or so and go through the different settings until you find the one that best correlates with recent past price action.
Do the same procedure for the Middle and Entry Timeframe. Once all the settings are how you prefer, view the Indicator on the Entry Timeframe to find trades.
Coding included to prevent repainting
Can be used in conjunction with the MTF Stochastic RSI w/ Zones which is displayed in the lower panel.
Need the same settings in both indicators for them to correlate or use different settings for different views,
Message me with feedback to improve upon this indicator or requested additions.
I will soon be releasing a Strategy based on this indicator!

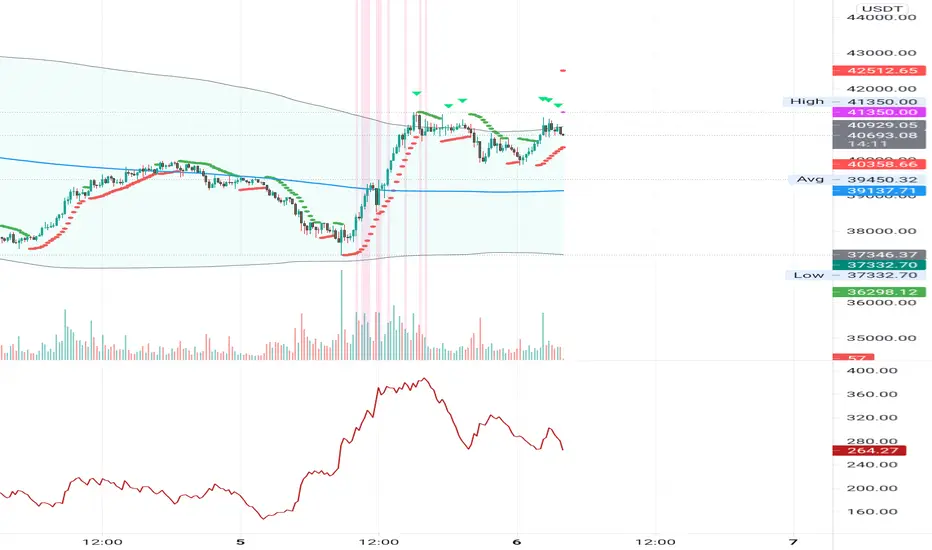
ATR Mark Up/DownThis script looks for a period with increased volatility, as measured by ATR (Average True Range), then it looks for a high or a low in that area.
When price is above EMA (200 is default, can be changed), it looks for the highs and adds multiples of ATR to the high. Default values for multipliers are 3,9 and 27, meaning that the script will show 3xATR level above the high, 9xATR above the high and 27xATR above the high.
When price is below EMA it looks for the lows and subtracts multiples of ATR from the low.The script will show 3xATR level below the low, 9xATR below the low and 27xATR below the low.
Multipliers values can be changed as well, making it a versatile tool that shows potential levels of suppport/resistance based on the volatility.
Possible use cases:
Breakout trading, when price crosses a certain level, it may show potential profit targets for trades opened at a breakout.
Stoploss helper. Many traders use ATR for their stoplosses, 1 ATR below the swing low for long trades and 1 ATR above the swing high for short trades are common values used by many traders. In this case, the Lookback value comes handy, if we want to look maybe at a more recent value for swing high/low point.
The levels shown by this indicator are not guaranteed to be or not to be reached by price, these levels should be used in confluence with other indicators and looked at as a visual helper.
That's all, hope you enjoy it!
PS.
*It does not plot the ATR. I don't know how to do it and IF it can be done
** It does not plot the EMA. If necessary,it can be added in a future update
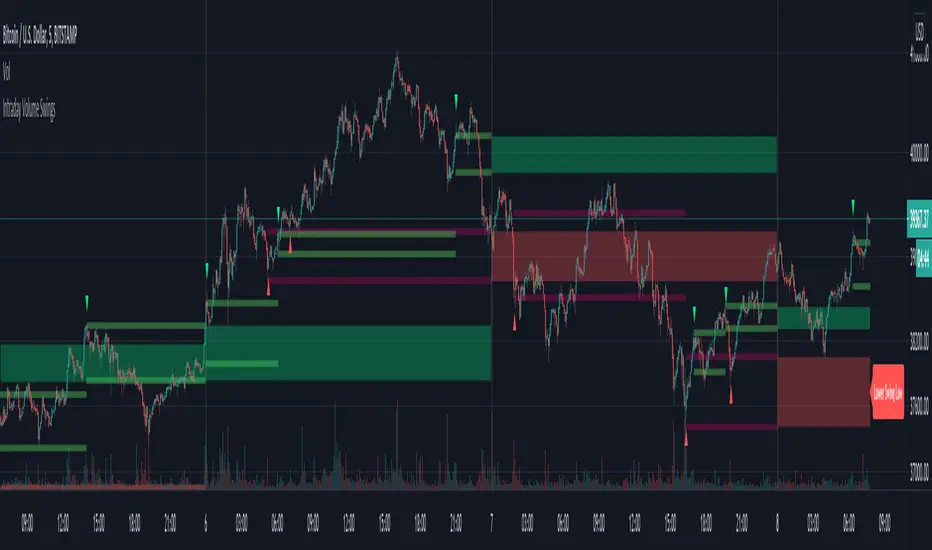
Intraday Volume SwingsVolume swings are defined as increasing volume and higher highs/lower lows over a minimum of three bars.
This script tracks volume swings over an intraday chart and stores the final lowest low swing / highest high swing over the course of the day. The final high swing and low swing are then plotted over the following day as possible retracement / support & resistance levels.
Intraday levels for the current day can also be displayed, which may or may not be the final swings for the day, but are also possible areas of interest.
See code for additional notes.
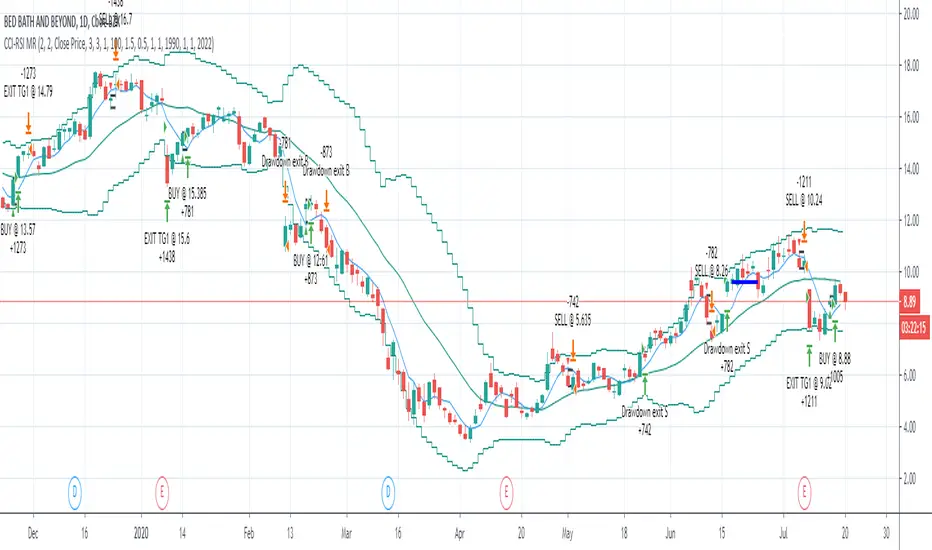
CCI-RSI MR Indicators:
Bollinger Bands (20 period, 2σ)
RSI (14 period) and Simple moving average of RSI (5 period)
CCI (20 period)
SMA (5 period)
Entry Conditions:
Buy when:
Swing low (5) should be lower than the highest of lower BB (3 periods)
Both RSI crossover RSI_5 and CCI crossover -100 should have happened within last 3 candles (including the current candle)
Once all the above conditions are met, the close should be higher than SMA (5) within the next 3 candles
After condition 3 is satisfied, we enter the trade at next candle’s open
Stop loss will be at 1 tick lower than previous swing low
Sell when:
Swing high (5) should be higher than the lowest of upper BB (3 periods)
Both RSI crossunder RSI_5 and CCI crossunder 100 should have happened within last 3 candles (including the current candle)
Once all the above conditions are met, the close should be lower than SMA (5) within the next 3 candles
After condition 3 is satisfied, we enter the trade at next candle’s open
Stop loss will be at 1 tick higher than previous swing high
Exit Conditions:
Since it’s mean reversion strategy we’ll be having only 2 target exits with a trailing stop loss after target price 1 is achieved.
Target exit price 1 & 2 are decided based on the risk ‘R’ for each trade
Depending on the instrument and time frame a trailing stop loss of 0.5R or 1R has opted.
A stop limit is placed @Entry_price +- 2*ATR(20) to offset the risk of losing significantly more than 1xR in a trade
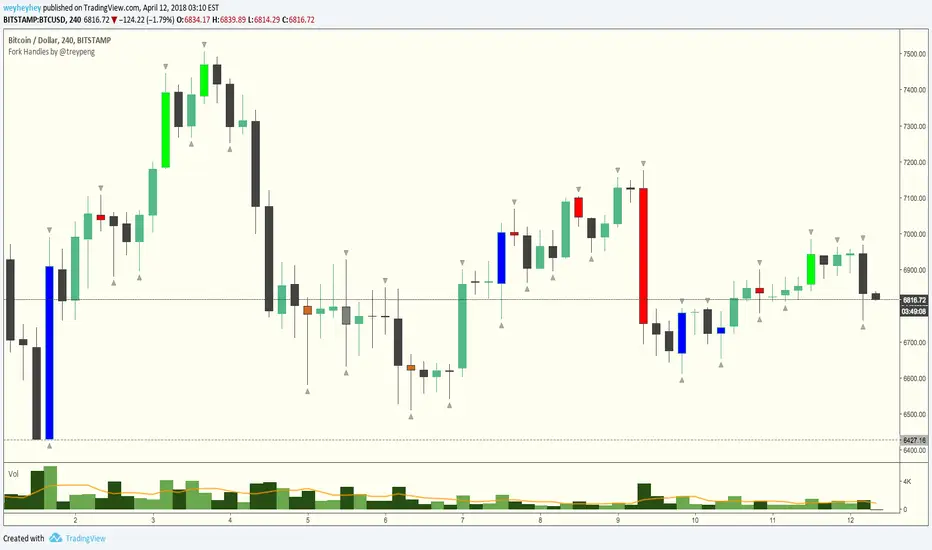
Fork Handles by @treypeng
Candle based indicator that shows swing highs and lows (pivots).
It draws an up or down arrow for simple three candle 'single' swings.
For stronger five candle 'double' swings, it colours the candle. Good for highlighting stronger reversals.
Both of these stylings can be toggled on/off individually.
Default colours
Swing HIGH on an UP candle: bright green
Swing HIGH on an DOWN candle: bright red
Swing LOW on an UP candle: blue
Swing LOW on an DOWN candle: brown
Double swings are grey or white.
Regular candles are just kept to your own default colours as specified in the chart settings.
👏 for anyone who gets the 'fork handles' joke reference.
Enhanced MTF Bias Table by Odegos# Enhanced MTF Bias Table - Publication Description
## Short Description (for TradingView listing)
Multi-timeframe bias indicator combining Market Structure Shifts (MSS) with EMA analysis. Displays real-time bias across 7 timeframes (5m-Weekly) with distance metrics and volatility measurements. Perfect for identifying trend alignment and potential reversal points.
---
## Full Description
### Overview
The **Enhanced MTF Bias Table** is a comprehensive multi-timeframe analysis tool designed to help traders quickly identify market bias across different time horizons. By combining Market Structure Shift (MSS) detection with Exponential Moving Average (EMA) analysis, this indicator provides a clear, color-coded view of market sentiment from short-term (5-minute) to long-term (weekly) timeframes.
### What This Indicator Does
**Core Functionality:**
- **Multi-Timeframe Analysis**: Simultaneously monitors 7 different timeframes (5m, 15m, 30m, 1h, 4h, Daily, Weekly)
- **Market Structure Detection**: Identifies when price breaks previous swing highs/lows, indicating potential trend changes
- **EMA-Based Bias**: Combines market structure with price distance from a customizable EMA to determine bias strength
- **Visual Market Structure Shifts**: Draws horizontal lines on the chart when significant market structure shifts occur
- **Real-Time Metrics**: Displays distance from EMA and ATR (volatility) for each timeframe
### How It Works
**Bias Calculation Logic:**
The indicator uses a sophisticated two-factor approach to determine market bias:
1. **Market Structure Analysis**:
- Tracks swing highs and lows using pivot points
- Identifies when price breaks above previous highs (bullish structure) or below previous lows (bearish structure)
- Uses a customizable lookback period to filter noise
2. **EMA Distance Analysis**:
- Measures how far price is from the selected EMA
- Strong bias requires BOTH structure break AND significant distance from EMA
- Neutral zone prevents false signals when price consolidates near the EMA
**Bias Categories:**
- **Strong ↑** (Dark Green): Bullish market structure + price above EMA threshold
- **Weak ↑** (Light Green): Bullish structure OR price moderately above EMA
- **Neutral** (Orange): Price within neutral zone around EMA
- **Weak ↓** (Light Red): Bearish structure OR price moderately below EMA
- **Strong ↓** (Dark Red): Bearish market structure + price below EMA threshold
### Key Features
**📊 Customizable Table Display:**
- Two table styles: Compact (minimal) or Full (detailed with labels)
- 9 position options to fit any chart layout
- Toggle distance from EMA and ATR displays
- Shows current symbol, timeframe, and date
**📈 Flexible Indicator Settings:**
- Adjustable EMA length (default: 50)
- Customizable MSS lookback period (5-50 bars)
- Breakout threshold adjustment for different instruments
- Neutral zone configuration to reduce noise
**📍 Visual Market Structure Shifts:**
- Draws horizontal lines at significant structure breaks
- Customizable colors for bullish/bearish MSS
- Optional text labels ("MSS") for easy identification
- Adjustable line width and style (solid, dashed, dotted)
**📉 EMA Overlay:**
- Optional EMA display on chart
- Full customization: color, width, line style
- Helps visualize the reference point for bias calculations
**🎨 Full Color Customization:**
- Independent color controls for all bias levels
- Customize header and table appearance
- Matches any chart theme or preference
### Best Use Cases
**1. Trend Alignment:**
Use the MTF table to identify when multiple timeframes align in the same direction. When 5-6 or more timeframes show the same bias, it indicates strong directional momentum.
**2. Divergence Detection:**
Look for disagreements between timeframes. For example, if higher timeframes (Daily/Weekly) show bearish bias while lower timeframes (5m/15m) show bullish bias, it may indicate a counter-trend bounce or potential reversal setup.
**3. Entry Timing:**
Use higher timeframe bias for direction and lower timeframe bias for entry timing. Enter trades when your trading timeframe aligns with higher timeframe bias.
**4. Risk Management:**
When lower timeframes show opposite bias to higher timeframes, it suggests trading against the major trend—requiring tighter stops and smaller positions.
**5. Market Structure Confirmation:**
The MSS lines help identify key levels where market structure changed, useful for:
- Stop loss placement (below/above MSS levels)
- Target setting (previous structure points)
- Breakout confirmation
### Recommended Settings by Instrument
**Index Futures:**
- **ES (S&P 500)**: Breakout Threshold: 0.15%, Neutral Zone: 0.15%
- **NQ (Nasdaq)**: Breakout Threshold: 0.25%, Neutral Zone: 0.20%
- **YM (Dow Jones)**: Breakout Threshold: 0.20%, Neutral Zone: 0.20%
**Forex Pairs:**
- **Major Pairs**: Breakout Threshold: 0.10%, Neutral Zone: 0.10%
- **Volatile Pairs**: Breakout Threshold: 0.20%, Neutral Zone: 0.15%
**Cryptocurrencies:**
- Breakout Threshold: 0.30-0.50%, Neutral Zone: 0.25-0.40%
- Higher volatility requires larger thresholds
### Understanding the Metrics
**Distance from EMA (%):**
- Positive values = Price above EMA (bullish territory)
- Negative values = Price below EMA (bearish territory)
- Larger absolute values = Stronger deviation from mean
- Useful for identifying overextended moves
**ATR (%):**
- Measures current volatility as percentage of price
- Higher values = More volatile conditions
- Helps adjust position sizing and stop distances
- Compare across timeframes to see where volatility concentrates
### Tips for Optimal Use
1. **Start with higher timeframes**: Check Daily and Weekly bias first to understand the bigger picture
2. **Use the 50 EMA default**: It's widely used and provides reliable support/resistance
3. **Adjust MSS lookback for your style**: Lower values (5-7) for day trading, higher values (15-25) for swing trading
4. **Watch for neutral zones**: Orange/neutral readings often precede significant moves
5. **Combine with price action**: Use MSS lines as reference points for entries and exits
6. **Don't ignore weak signals**: "Weak" bias often precedes strong moves as structure builds
### What Makes This Different
Unlike simple moving average indicators, this script:
- Combines TWO confirmation factors (structure + distance) for more reliable signals
- Provides context across multiple timeframes simultaneously
- Visually marks important market structure changes on your chart
- Offers both compact and detailed display modes
- Includes volatility measurement to gauge market conditions
### Technical Notes
- Uses `request.security()` to fetch data from multiple timeframes
- Implements `pivothigh()` and `pivotlow()` for swing detection
- All calculations use `lookahead=barmerge.lookahead_off` to prevent repainting
- MSS lines drawn in real-time as structure breaks occur
- Optimized for performance with minimal script resources
### Disclaimer
This indicator is a tool for analysis and does not provide trading signals or financial advice. Always:
- Use proper risk management
- Combine with other forms of analysis
- Test thoroughly in a demo environment
- Understand that past performance doesn't guarantee future results
- Consider market conditions and fundamental factors
---
## Tags (for TradingView)
multi-timeframe, market-structure, bias, trend, EMA, momentum, support-resistance, price-action, volatility, ATR, swing-trading, day-trading
## Category
Trend Analysis / Multi-Timeframe Analysis
---
## Quick Start Guide
**For Day Traders:**
1. Add indicator to your chart
2. Focus on 5m, 15m, 30m, and 1h timeframes
3. Look for alignment across these timeframes
4. Use MSS lines as entry/exit reference points
**For Swing Traders:**
1. Add indicator to your chart
2. Focus on 4h, Daily, and Weekly timeframes
3. Wait for 2-3 timeframe alignment
4. Use lower timeframes only for entry timing
**For Position Traders:**
1. Add indicator to your chart
2. Focus on Daily and Weekly timeframes
3. Ignore short-term noise
4. Enter when both show same strong bias

eBacktesting - Learning: Liquidity GrabseBacktesting - Learning: Liquidity Grabs highlights moments when price pushes just beyond a recent swing high or swing low (where many stops tend to sit) and then quickly returns back inside the level. This behavior is often called a stop run, sweep, or liquidity grab.
Traders study these events because they can reveal:
- Where liquidity is “resting” (obvious highs/lows)
- A quick sweep and rejection (often a wick)
- When a breakout attempt is actually a trap
- A full candle close through the level, followed by an immediate reversal back inside (classic breakout trap)
- Potential areas where price may reverse or accelerate after stops are taken
Use it as a training tool to build pattern recognition and improve your patience around key levels, especially during active sessions where sweeps happen frequently.
These indicators are built to pair perfectly with the eBacktesting extension, where traders can practice these concepts step-by-step. Backtesting concepts visually like this is one of the fastest ways to learn, build confidence, and improve trading performance.
Educational use only. Not financial advice.

Fibonacci Sequence Grid [BigBeluga]🔵 OVERVIEW
A geometric price mapping tool that projects Fibonacci sequence levels and grid structures from recent price swings to help traders visualize natural expansion and reversion zones.
This indicator overlays Fibonacci-based structures directly on the chart, utilizing both grid projections and horizontal levels based on the classic Fibonacci integer sequence (0, 1, 1, 2, 3, 5, 8, ...). It identifies recent swing highs or lows and builds precision-aligned levels based on the trend direction.
🔵 CONCEPTS
Uses the Fibonacci integer sequence (not ratios) to define distances from the most recent swing point.
Identifies a trend based on EMA cross of fast and slow periods.
Projects two types of Fibonacci tools:
A grid projection from the swing point, displaying multiple sloped levels based on the sequence.
A set of horizontal Fibonacci levels for clean structural references.
Levels can be plotted from either swing low or high depending on the current trend direction.
Adjustable “Size” inputs control spacing between levels for better price alignment.
Lookback period defines how far the script searches for recent swing extremes.
🔵 FEATURES
Fibonacci Grid Projection:
Draws two mirrored Fibonacci grids—one expanding away from the swing high/low, the other converging toward price.
Swing-Based Trend Detection:
Uses a fast/slow EMA crossover to determine trend direction and reference swing points for projections.
Fibonacci Sequence Levels:
Displays horizontal levels based on the Fibonacci number sequence (0, 1, 2, 3, 5, 8, 13, 21...) for natural price targets.
Dynamic Labels and Coloring:
Each level is labeled with its sequence value and colored based on trend direction (e.g., red = downtrend, green = uptrend).
Both grids and levels can be toggled on/off independently.
Sizing controls allow tighter or looser clustering of levels depending on chart scale.
🔵 HOW TO USE
Enable Fibonacci Grid to visualize price expansion zones during impulsive trends.
Use Fibonacci Levels as horizontal support/resistance or target zones.
A label below price means the current trend is up and levels are projected from swing low.
A label above price means trend is down and levels are projected from swing high.
Adjust “Size” input to fit grid/level projection to your preferred chart scale or instrument volatility.
Use in confluence with price action, trend indicators, or volume tools for layered trading decisions.
🔵 CONCLUSION
Fibonacci Sequence Grid reimagines Fibonacci analysis using whole-number spacing from natural math progressions. Whether used for projecting grid-based expansions or horizontal support/resistance zones, it provides a powerful and intuitive structure to trade within. Perfect for traders who rely on symmetry, market geometry, and mathematically consistent levels.

eBacktesting - Learning: Buy/Sell-side LiquidityeBacktesting - Learning: Buy/Sell-side Liquidity
Buy-side and sell-side liquidity are some of the most important “magnets” in day trading. When price forms obvious swing highs and swing lows, stop-loss orders often build up just above those highs (buy-side liquidity) and just below those lows (sell-side liquidity). Markets frequently move into these areas to “take” that liquidity before making the next meaningful move.
This indicator helps you spot those potential liquidity pools and highlights when price reaches them. Use it to study:
- where stops are likely resting above highs / below lows
- how often price sweeps those areas before reversing
- how liquidity runs can trigger the next expansion or trend continuation
These indicators are built to pair perfectly with the eBacktesting extension, where traders can practice these concepts step-by-step. Backtesting concepts visually like this is one of the fastest ways to learn, build confidence, and improve trading performance.
Educational use only. Not financial advice.

Liquidity Zones (Pivot-based) Buyside/SellsideDescription
This indicator highlights potential liquidity zones based on confirmed swing highs and swing lows (pivot-based logic).
Buyside liquidity zones are drawn above swing highs, where short stops and breakout liquidity are likely to rest.
Sellside liquidity zones are drawn below swing lows, where long stops are typically clustered.
Zones are sized dynamically using ATR-based thickness, extended forward in time, and automatically removed once price trades through them (wick-based or close-based, configurable).
The script is designed to help traders:
Visualize areas where liquidity is likely to be targeted
Anticipate stop hunts and liquidity grabs
Improve timing around reversals, continuations, and range extremes
This tool is not a liquidation heatmap and does not rely on exchange or order book data.
Instead, it provides a price-action–based proxy for liquidity, fully compatible with ICT / SMC-style market structure analysis.
Key features :
-Pivot-based buyside & sellside liquidity zones
-ATR-adjusted zone thickness
-Automatic extension and cleanup of zones
-Adjustable sensitivity and zone limits
-Works on any market and timeframe

Liquidity Sweeps by EVThis indicator is designed to detect liquidity sweeps and stop hunts by identifying when price briefly moves beyond key swing highs or lows and then rejects those levels. It highlights areas where buy-side or sell-side liquidity has been taken, offering traders a clear and objective way to read liquidity-driven market behavior.
Buy-side liquidity sweeps occur when price trades above a previous swing high and fails to hold, while sell-side liquidity sweeps occur when price trades below a previous swing low and quickly recovers. All detections are based on confirmed pivots, ensuring the indicator is fully non-repainting and reliable in live trading conditions.
The indicator allows users to choose between close-based or wick-based confirmation and can optionally mark only the first sweep of each liquidity level to reduce chart noise. Liquidity levels can be visualized directly on the chart, providing precise contextual references for market structure, VWAP confluence, and potential reversals.

Support Resistance by EVThis indicator is designed to provide a clean and practical market structure view by combining automatic support and resistance detection with dynamic trend analysis. It identifies key support and resistance levels using confirmed swing highs and lows, intelligently merging nearby levels based on market volatility and filtering out outdated or irrelevant zones to keep the chart clear and focused on what matters now.
In addition to horizontal support and resistance, the indicator offers two complementary ways to read trend context. It can display diagonal trendlines built from the most recent swing highs and swing lows to visualize directional structure, or horizontal trend rays based on the latest pivots to highlight dynamic support and resistance acting as trend references. The user can switch between these modes depending on trading style and market conditions.
All visual elements are anchored by time rather than bar index to ensure stability when zooming or scrolling the chart. The indicator is fully non-repainting, relies only on confirmed pivots, and is suitable for any market or timeframe. It is intended as an open-source, professional-grade tool that helps traders quickly identify structure, trend bias, and key reaction levels without clutter or visual noise.

eBacktesting - Learning: Change of CharactereBacktesting - Learning: Change of Character helps you spot a “Change of Character” (CHoCH) — the moment price stops behaving one way and starts behaving the other.
It does this by tracking clear swing highs and swing lows, then marking the first **candle close** that breaks structure **against** the current move:
- Bullish CHoCH: price shifts from making lower structure to breaking above a key swing high.
- Bearish CHoCH: price shifts from making higher structure to breaking below a key swing low.
Use CHoCH to practice timing: early trend shifts, reversals, and potential new legs — especially when combined with your usual confluence (liquidity, premium/discount, key levels, sessions, etc.).
These indicators are built to pair perfectly with the eBacktesting extension, where traders can practice these concepts step-by-step. Backtesting concepts visually like this is one of the fastest ways to learn, build confidence, and improve trading performance.
Educational use only. Not financial advice.

HTR Reclaim Hunter
🏹 HTR Reclaim Hunter
(1H Execution + Zones + 4H Bias)
HTR Reclaim Hunter is a trend-continuation indicator designed to identify high-probability pullback & reclaim entries using multi-timeframe bias, EMA structure, and dynamic reclaim zones.
This indicator is best suited for swing trading and intraday continuation setups, especially in trending markets.
🔑 CORE CONCEPT
Trade WITH the higher-timeframe trend.
Enter on pullbacks.
Confirm strength on reclaim.
HTR Reclaim Hunter combines:
4H trend bias
1H execution logic
EMA reclaim structure
Supply & demand reclaim zones
Built-in SL / TP visualization
🧭 RECOMMENDED SETTINGS
Best timeframe: 1H (designed for this)
Markets: Stocks, Crypto, Futures, Forex
Works best in: Trending markets (not chop)
📊 WHAT YOU SEE ON THE CHART
🔹 EMA Structure
EMA 50 (green): Trend filter
EMA 9 (colored): Momentum & pullback guide
🔹 Reclaim Zones
Green boxes: Support / demand zones
Red boxes: Resistance / supply zones
These zones highlight areas where price previously reacted and may reclaim.
🔹 Trade Signals
LONG label: Bullish reclaim setup
SHORT label: Bearish reclaim setup
🔹 Risk Levels (Optional)
Stop Loss (Red)
TP1 (Orange)
TP2 (Green)
🟢 LONG TRADE RULES
A LONG signal appears when ALL of the following are true:
4H trend is bullish
Price above 4H EMA 50
EMA 50 is rising
1H trend is bullish
Price above EMA 50
EMA 9 above EMA 50
Pullback occurs
Price pulls back below EMA 9
Reaches or taps EMA 50
Reclaim confirmation
Strong bullish candle closes back above EMA 9
Candle is not a doji
Signal prints
A green LONG label appears
👉 This indicates a trend continuation entry, not a reversal.
🔴 SHORT TRADE RULES
A SHORT signal appears when ALL of the following are true:
4H trend is bearish
Price below 4H EMA 50
EMA 50 is falling
1H trend is bearish
Price below EMA 50
EMA 9 below EMA 50
Pullback occurs
Price pulls back above EMA 9
Reaches or taps EMA 50
Reclaim confirmation
Strong bearish candle closes back below EMA 9
Candle is not a doji
Signal prints
A red SHORT label appears
🛑 STOP LOSS & TAKE PROFIT
When enabled, the indicator automatically plots:
Stop Loss
Based on recent swing high / low
TP1
1R (1× risk)
TP2
Configurable runner target (default 2R)
These are visual guides only — always manage risk according to your plan.
⚠️ IMPORTANT NOTES
This indicator is not meant for ranging or choppy markets
Best results occur when:
EMA 50 is clearly sloped
Price respects reclaim zones
Always confirm with:
Market structure
Volume
Higher-timeframe context
🔔 ALERTS
Alerts are available for:
HRH LONG
HRH SHORT
Alerts trigger on confirmed reclaim signals, not on every pullback.
❗ DISCLAIMER
This indicator is for educational purposes only.
It does not provide financial advice.
Always test and manage risk appropriately.
🏹 FINAL TIP
HTR Reclaim Hunter works best when you are patient.
Skip chop.
Wait for clean trends.
Hunt only high-quality reclaims.
If you want, I can also:
Write a short description version
Create a “Quick Start” section
Add example captions for screenshots
Help you choose TradingView tags & category
trend-following
ema reclaim
pullback strategy
multi-timeframe
price action

Smart Money Structure█████████████████████████████████████████████████████████████████████████████
█ SMART MONEY STRUCTURE | SMS Pro
█ Institutional Order Flow & Liquidity Zones
█ by @scalping-algo
█████████████████████████████████████████████████████████████████████████████
📋 OVERVIEW
━━━━━━━━━━━━━━━━━━━━━━━━━━━━━━━━━━━━━━━━━━━━━━━━━━━━━━━━━━━━━━━━━━━━━━━━━━━━━
This indicator automatically detects and plots Smart Money Concepts (SMC)
including Break of Structure (BOS), Demand & Supply Zones, and Flip Zones.
Perfect for traders who follow institutional order flow and price action.
🎯 INDICATOR COMPONENTS
━━━━━━━━━━━━━━━━━━━━━━━━━━━━━━━━━━━━━━━━━━━━━━━━━━━━━━━━━━━━━━━━━━━━━━━━━━━━━
⚡ BOS (Break of Structure)
┄┄┄┄┄┄┄┄┄┄┄┄┄┄┄┄┄┄┄┄┄┄┄┄┄┄
• Bullish BOS: Price breaks above previous swing high → Trend shift UP
• Bearish BOS: Price breaks below previous swing low → Trend shift DOWN
✦ How to use:
→ Wait for BOS confirmation before entering trades
→ Bullish BOS = Look for long entries
→ Bearish BOS = Look for short entries
→ Combine with zones for high-probability setups
🟦 DEMAND ZONE (Teal Box)
┄┄┄┄┄┄┄┄┄┄┄┄┄┄┄┄┄┄┄┄┄┄┄┄┄
• Last bearish candle before a bullish BOS
• Institutional buying area / Unfilled orders
✦ How to use:
→ Wait for price to retrace into the zone
→ Look for bullish rejection / confirmation candle
→ Enter LONG with stop below the zone
→ Target: Previous high or next supply zone
🟪 SUPPLY ZONE (Purple Box)
┄┄┄┄┄┄┄┄┄┄┄┄┄┄┄┄┄┄┄┄┄┄┄┄┄┄
• Last bullish candle before a bearish BOS
• Institutional selling area / Unfilled orders
✦ How to use:
→ Wait for price to retrace into the zone
→ Look for bearish rejection / confirmation candle
→ Enter SHORT with stop above the zone
→ Target: Previous low or next demand zone
🔵 FLIP+ / MIT+ (Cyan Box)
┄┄┄┄┄┄┄┄┄┄┄┄┄┄┄┄┄┄┄┄┄┄┄┄┄
• FLIP+: Old supply zone that flipped to demand (breaker block)
• MIT+: Mitigation zone - area where price may return to rebalance
✦ How to use:
→ Stronger than regular demand zones
→ Price often reacts sharply at flip zones
→ Great for continuation trades after BOS
→ Enter LONG when price taps the zone
🔴 FLIP- / MIT- (Pink Box)
┄┄┄┄┄┄┄┄┄┄┄┄┄┄┄┄┄┄┄┄┄┄┄┄┄
• FLIP-: Old demand zone that flipped to supply (breaker block)
• MIT-: Mitigation zone - area where price may return to rebalance
✦ How to use:
→ Stronger than regular supply zones
→ Price often reacts sharply at flip zones
→ Great for continuation trades after BOS
→ Enter SHORT when price taps the zone
📐 STRUCTURE LINES (Gray Dashed)
┄┄┄┄┄┄┄┄┄┄┄┄┄┄┄┄┄┄┄┄┄┄┄┄┄┄┄┄┄┄┄
• Connects swing highs and lows
• Shows market structure and trend direction
✦ How to use:
→ Upward sloping = Bullish structure
→ Downward sloping = Bearish structure
→ Trade in the direction of structure
📊 TRADING STRATEGY
━━━━━━━━━━━━━━━━━━━━━━━━━━━━━━━━━━━━━━━━━━━━━━━━━━━━━━━━━━━━━━━━━━━━━━━━━━━━━
LONG SETUP:
┌─────────────────────────────────────────┐
│ 1. Wait for Bullish ⚡ BOS │
│ 2. Mark the DEMAND or FLIP+ zone │
│ 3. Wait for price to retrace to zone │
│ 4. Enter on bullish confirmation │
│ 5. Stop loss: Below the zone │
│ 6. Take profit: Next SUPPLY zone │
└─────────────────────────────────────────┘
SHORT SETUP:
┌─────────────────────────────────────────┐
│ 1. Wait for Bearish ⚡ BOS │
│ 2. Mark the SUPPLY or FLIP- zone │
│ 3. Wait for price to retrace to zone │
│ 4. Enter on bearish confirmation │
│ 5. Stop loss: Above the zone │
│ 6. Take profit: Next DEMAND zone │
└─────────────────────────────────────────┘
⚙️ SETTINGS GUIDE
━━━━━━━━━━━━━━━━━━━━━━━━━━━━━━━━━━━━━━━━━━━━━━━━━━━━━━━━━━━━━━━━━━━━━━━━━━━━━
• Structure Length (default: 9)
└─ Higher = Less signals, stronger zones
└─ Lower = More signals, more noise
└─ Recommended: 7-14 depending on timeframe
• Confirmation Factor (default: 0.33)
└─ Filters out weak structure breaks
└─ Higher = More confirmation needed
└─ Lower = Earlier signals
• Auto-Remove Broken Zones
└─ ON: Removes zones when price breaks through
└─ OFF: Keeps all zones visible
💡 PRO TIPS
━━━━━━━━━━━━━━━━━━━━━━━━━━━━━━━━━━━━━━━━━━━━━━━━━━━━━━━━━━━━━━━━━━━━━━━━━━━━━
✓ Use higher timeframes (4H, Daily) for stronger zones
✓ Combine with volume analysis for confirmation
✓ FLIP zones are generally stronger than regular zones
✓ Fresh (untested) zones have higher probability
✓ Multiple timeframe analysis = Higher accuracy
✓ Don't trade against the BOS direction
⚠️ RISK DISCLAIMER
━━━━━━━━━━━━━━━━━━━━━━━━━━━━━━━━━━━━━━━━━━━━━━━━━━━━━━━━━━━━━━━━━━━━━━━━━━━━━
Trading involves substantial risk. Past performance is not indicative of
future results. This indicator is a tool to assist your analysis, not a
guarantee of profits. Always use proper risk management.
━━━━━━━━━━━━━━━━━━━━━━━━━━━━━━━━━━━━━━━━━━━━━━━━━━━━━━━━━━━━━━━━━━━━━━━━━━━━━
📧 Questions? Leave a comment below!
⭐ If you find this useful, please give it a BOOST!
🔔 Follow @scalping-algo for more indicators
━━━━━━━━━━━━━━━━━━━━━━━━━━━━━━━━━━━━━━━━━━━━━━━━━━━━━━━━━━━━━━━━━━━━━━━━━━━━━

TA Confluence Scanner v2.9 | Mint_Algo📘 TA Confluence Scanner
Introduction
The TA Confluence Scanner is a multi-factor trend system designed to filter market noise and identify high-probability trade setups. By combining adaptive algorithms (KAMA) with Price Action methodologies (SMC, Breakouts, Fractals), this indicator operates on the principle of Confluence : a signal is only valid when multiple independent tools agree on the direction.
Instead of relying on a single lagging indicator (like just MA fast and slow crossover), this script acts as a "Scanner," evaluating the market state through Volatility, Trend Structure, and Equilibrium.
───────────────────────────────────────────────────
Important Note
To make this "Plug & Play," I have included optimized presets in the settings for different timeframes (1m/15m-1h/4h-1D) and trading styles (Scalper, Intraday, Swing, Investor) tested on symbols:
FX:EURUSD
IG:NASDAQ
BITSTAMP:BTCUSD
BINANCE:ETHUSD
CAPITALCOM:US500
OANDA:XAUUSD
NASDAQ:AAPL
NASDAQ:TSLA
BUT default settings already include a good preset which excludes most of the noise and grabs the trend better (fewer entries, but quality is higher).
Check the presets at the bottom 👇
───────────────────────────────────────────────────
Core Features
Adaptive Trend Filter (KAMA): Adjusts to market volatility to distinguish between chop and true trends.
SMC Equilibrium (EQ) Fans: A three-tiered dynamic structure (Fast, Medium, Slow) for trailing stops and targets.
Confluence Counter: Visually displays the strength of a signal (e.g., "Strong 4/6") based on how many factors align.
Re-Entry Logic: Identifies low-risk entry points within an existing trend.
Automated S/R & Breakouts: Detects key pivot levels and structural breaks.
───────────────────────────────────────────────────
Settings & Components Breakdown
1. KAMA (Primary Trend Filter)
The backbone of the system. It calculates the Efficiency Ratio (ER) of price movement.
How it works: If the ER is high (strong trend), KAMA follows price closely. If ER is low (ranging), KAMA flattens out to prevent false signals.
Tuning:
Fast (ER ~100/5/60): For Scalping.
Smooth: Default settings are optimized for a balance between lag and noise reduction.
2. SMC Equilibrium (EQ Structure)
Based on the HL2 formula (High+Low / 2), this creates a "fan" of three lines:
EQ1 (Fast): The aggressive line. Used for early exits or scalping stops.
EQ2 (Medium): The baseline trend structure.
EQ3 (Slow): The major trend container. Used for position trading.
Usage: Use these lines to gauge how far price has deviated from its "fair value."
3. Breakout & Internal Trend
Lookback Period: Defines the range for a valid breakout. A lower lookback (e.g., 10) gives earlier signals but more noise; a higher lookback (e.g., 20-30) confirms significant structural breaks.
Internal Trend: A simplified SMA check to ensure immediate momentum aligns with the macro trend.
4. Signal Strength (The Confluence Meter)
The indicator counts active signals from: KAMA, Internal Trend, S/R, FVG, Breakout, and EQ.
Strong Signal: When the count hits your threshold (e.g., 4/6 ). This suggests a high-probability reversal or breakout.
Medium Signal (Triangles): These appear when the trend is active but not all filters align. These are excellent continuation/re-entry points.
───────────────────────────────────────────────────
How to Trade (Strategy Guide)
🎯 The Entry
Wait for a Strong Signal (Large Label). This confirms that volatility, structure, and momentum have aligned.
Conservative: Wait for the candle to close.
Aggressive: Enter on the breakout of the KAMA line.
🔄 Re-Entry & Continuation
Markets rarely move in a straight line.
Scenario: You missed the initial "Strong" entry, or you took profit and want to re-enter.
The Signal: Look for the small Triangles (Medium signals). These often appear after a pullback when price resumes the main trend.
Logic: If the main KAMA trend is still green/red, but the "Strong" signal isn't firing, a Triangle indicates a safe place to add to a position.
⚠️ Pyramiding & Risk Management (Advanced)
The EQ Lines (Fast/Medium/Slow) are designed for a tiered position management strategy:
Entry: Open position (e.g., 0.03 lots).
First Take Profit: When price extends far beyond EQ1 (Fast) , lock in partial profits.
Trailing Stop: Move your Stop Loss to trace the EQ2 (Medium) line.
Trend Riding: Hold the "Runner" portion of your position until price closes back under EQ3 (Slow) or the KAMA line.
Tip: Use William Fractals (Period 2) to pinpoint exact swing highs/lows for tightening stops.
───────────────────────────────────────────────────
Presets & Optimized Settings
To make this "Plug & Play," I have included optimized presets in the settings for different trading styles.
(If you don't see some parameters, that means they are turned off in trading mode)
⚡ SCALPER (1m - 5m)
KAMA:
ER: 100
Fast Length: 15
Slow Length: 30
FVG:
Size %: 0.01
Trend Detection:
Length: 20
Breakout:
Lookback Period: 10
S/R Detection:
Pivot Length: 10
Tolerance: 0.3
SMC EQ:
Default: 10
EQ1: 10
EQ2 (Main): 30
EQ3: 120
Signal Strength:
Strong: 4
Medium: 3
📊 INTRADAY (15m - 1H)
KAMA:
ER: 100
Fast Length: 5
Slow Length: 30
Trend Detection:
Length: 100
Breakout:
Lookback Period: 30
S/R Detection:
Pivot Length: 20
Tolerance: 0.5
SMC EQ:
Default: 10
EQ1: 10
EQ2 (Main): 40
EQ3: 80
Signal Strength:
Strong: 4
Medium: 3
📈 SWING (4H - 1D)
KAMA:
ER: 30
Fast Length: 4
Slow Length: 30
Trend Detection:
Length: 50
Breakout:
Lookback Period: 20
S/R Detection:
Pivot Length: 30
Tolerance: 0.7
SMC EQ:
Default: 10
EQ1: 10
EQ2: 50
EQ3 (Main): 60
Signal Strength:
Strong: 4
Medium: 3
💼 INVESTOR (4H - 1D+)
KAMA:
ER: 30
Fast Length: 5
Slow Length: 10
Trend Detection:
Length: 100
Breakout:
Lookback Period: 50
S/R Detection:
Pivot Length: 30
Tolerance: 0.7
SMC EQ:
Default: 10
EQ1: 10
EQ2: 50
EQ3 (Main): 100
Signal Strength:
Strong: 4
Medium: 3
───────────────────────────────────────────────────
Notes
FVG (Fair Value Gaps): Optional. Enable if you trade volatile assets like Crypto/Gold where imbalances are common.
Support/Resistance: The built-in Pivot system is optional. Disable it if you prefer drawing your own levels to keep the chart clean.
Recommended Pairing:
For best results, pair this with a momentum oscillator like RSI to detect the range regime of a trend. Or DI+ and DI- (when it crosses over each other, that means the "range of possible" regime change of a trend).
───────────────────────────────────────────────────
Disclaimer:
This tool is for informational purposes only. "Confluence" increases probability but does not guarantee results. Always manage your risk.

Stop Loss Hunting Zones This Pine Script indicator identifies and visualizes potential "stop loss hunting zones" on charts. It marks price levels where institutional traders or market makers might trigger retail stop losses before reversing direction, helping traders avoid false breakouts and better time their entries.
Key Features:
Four Types of Detection Zones-
1.Swing Zones (Red/Green): Identifies swing highs and lows using pivot point analysis where stop losses typically cluster above resistance and below support levels.
2.Breakout Zones (Orange): Detects consolidation periods and marks levels where false breakouts might occur, trapping traders who enter too early.
3.Wick Trap Zones (Purple): Highlights candles with disproportionately large wicks relative to body size, indicating potential stop loss raids with quick reversals.
4.Volume Reversal Zones (Blue): Identifies high-volume reversal patterns where price briefly touches a level before sharply reversing, suggesting stop loss absorption.
Customizable Parameters:
Swing Lookback: Period for pivot point detection (5-100 bars)
Swing Threshold: Minimum percentage move to qualify as a swing (0.5-10%)
Volume Threshold: Multiplier for detecting unusual volume (1-5x average)
Wick Ratio: Minimum wick-to-total range ratio for trap detection (0.3-0.9)
ATR Settings: Length and multiplier for zone buffer calculation
Zone Management: Maximum zones per type and minimum distance between zones
Display Options: Toggle individual zone types, heatmap intensity, labels, and transparency
Visual Features:
Heatmap Mode: Colour intensity reflects how often price has tested each zone
Smart Zone Management: Prevents chart cluttering by limiting zones and removing those too close together
Dynamic Labels: Clear zone identification with customizable display
Adjustable Transparency: Control zone visibility (10-90%)
How It Works:
The indicator uses ATR-based buffers to create zones around detected levels. It tracks price history to calculate "intensity" scores for the heatmap feature, helping identify the most significant hunting zones. The algorithm ensures zones are meaningful by enforcing minimum distances and limiting total zones displayed.
Avoid placing stop losses at obvious levels where hunting is likely
Identify potential reversal points for counter-trend trades
Recognize false breakout patterns before they complete
Time entries after stop loss hunts are absorbed
Technical Details:
Maximum 500 boxes, lines, and labels for comprehensive zone tracking
Compatible with all timeframes
Works on any market (stocks, forex, crypto, futures)
Real-time detection as new bars confirm
This indicator is designed for traders who want to understand where institutional players might target retail stop losses and use that information to their advantage. Please boost & follow for more. Happy trading !!
Disclaimer: This indicator is for educational and informational purposes only. It should not be considered financial advice. Always perform your own analysis and risk management before trading.

Swiss Army Knife Multi-ToolMulti-Tools is a comprehensive trading indicator suite designed to streamline your chart analysis by combining six essential tools into one powerful, customizable package. Whether you're day trading futures, swing trading stocks, or scalping forex, this indicator provides the key reference points and signals you need—all without cluttering your chart.
🎯 Included Tools
1. Big Round Numbers (BRN)
Automatically plots psychological price levels that institutions and retail traders alike tend to watch. These levels often act as magnets for price or create support/resistance zones.
Customizable increment spacing (100, 50, 25, etc.)
Half and quarter level options
Adjustable number of levels displayed
2. HTF Moving Averages
A complete multi-period moving average suite with trend alignment detection.
5 customizable periods (default: 9, 21, 50, 100, 200)
Multiple MA types: EMA, SMA, WMA, VWMA, HMA, DEMA
Visual ribbon fill option
Golden/Death cross signals
Real-time alignment status in dashboard
3. Stop Finder
Intelligent stop loss calculation using two methodologies:
ATR-Based Stops: Dynamic stops that adapt to current volatility
Swing-Based Stops: Stops placed below recent swing lows (longs) or above swing highs (shorts)
Customizable ATR period and multiplier
4. Target Finder
Risk:Reward-based take profit levels calculated from your stop distance.
Three customizable R:R targets (default: 1R, 2R, 3R)
Visual plot options (circles, lines, step lines)
Real-time calculations in the dashboard
5. Uni Zones (Supply/Demand)
Identifies consolidation zones and potential breakout opportunities.
Basing bar detection based on body-to-range ratio
Breakout signals when price exits the zone
Background highlighting during active basing periods
6. Money Flow Index (MFI)
Volume-weighted momentum oscillator to identify potential exhaustion points.
Overbought/Oversold highlighting
Customizable threshold levels
Background color alerts for extreme readings
📊 Information Dashboard
A clean, customizable dashboard displays real-time values:
MA trend alignment status
Price position relative to 200 MA
Nearest round number and distance
Current ATR value in price and ticks
Suggested stop loss and take profit levels
MFI status and value
Active basing zone detection

Classic Chartism-Market Structure- Support.ResistanceClassic Chartism – Market Structure + Support & Resistance
This indicator is designed for traditional chart-based technical analysis, relying exclusively on price action and market structure, without the use of oscillators or lagging indicators.
The script automatically detects significant swing highs and swing lows using confirmed pivots and classifies price structure according to classic market structure notation:
HH (Higher High)
HL (Higher Low)
LH (Lower High)
LL (Lower Low)
Based on these swings, the indicator plots horizontal Support & Resistance (SR) levels, representing historically significant areas of supply and demand. These levels remain active until invalidated by price, providing a clear and objective market context.
The indicator does not repaint once a swing is confirmed, making it suitable for real-time analysis and discretionary trading decisions. It performs well across cryptocurrencies, futures, indices, and equities, and is particularly useful for trend identification, pullback entries, and structure-based risk management.

Liquidity Trap Detector Pro [PyraTime]The Problem: Why You Get Stopped Out
90% of retail traders place their stop-losses at obvious swing highs and lows. Institutional algorithms ("Smart Money") are programmed to push price through these levels to trigger liquidity, fill their heavy orders, and then immediately reverse the market.
If you have ever had your stop hit right before the market moves exactly where you predicted—you were the victim of a Liquidity Trap.
The Solution: Visualizing the "Stop Hunt"
Liquidity Trap Detector Pro is not just a support/resistance indicator. It is a comprehensive Reversal Scoring Engine.
Unlike standard indicators that spam signals on every wick, this tool uses a proprietary 5-Star Scoring System to analyze the quality of the trap. It validates every signal using Wick Symmetry, RSI Divergence, and Volume Analysis to separate a true reversal from a trend continuation.
Key Features (USP)
- 5-Star Scoring Engine: Every signal is rated from 1 to 5 stars. Stop guessing if a signal is valid; let the algorithm check the confluence for you.
- Glassmorphism Visuals: Gone are the messy lines. We use modern, semi-transparent "Liquidity Zones" that keep your chart clean and professional.
- Smart Terminology: Automatically identifies Bull Traps (Buyers trapped at highs) and Bear Traps (Sellers trapped at lows).
- Heads-Up Display (HUD): A professional dashboard monitors the market state, active filters, and recent trap statistics in real-time.
- Strict Non-Repainting: (Technical Note) This script uses strict non-repainting logic. All Higher Timeframe (HTF) data is confirmed and closed before a signal is generated, ensuring historical accuracy.
---
Tutorial: How to Trade This Indicator
1. Understanding the Signals
We use correct institutional terminology to describe the market mechanics:
GREEN Signal (BEAR TRAP):
- What happened: Price swept a Swing Low, enticing sellers (Bears) to enter. The candle then reversed and closed back inside the range, trapping those sellers.
- The Trade: This is a Bullish Reversal setup (Long).
RED Signal (BULL TRAP):
- What happened: Price swept a Swing High, enticing buyers (Bulls) to breakout. The candle reversed and closed lower, trapping the buyers.
- The Trade: This is a Bearish Reversal setup (Short).
2. The 5-Star Scoring System
Not all traps are created equal. The stars tell you how much "Confluence" exists:
- 1 Star: A basic structure sweep. Risky.
- 3 Stars: A solid setup backed by either Volume or Divergence.
- 5 Stars: The "Perfect" Trap. Structure Sweep + RSI Divergence + Volume Spike + Wick Symmetry. High Probability.
3. The Strategy
- Wait for the Zone: Watch price approach a coloured Liquidity Zone.
- Observe the Reaction: Do not trade blindly. Wait for the candle to close.
- Check the Stars: Look for at least 3 Stars before considering an entry.
- Confirm with HUD: Glance at the Dashboard to ensure the "RSI Filter" and "Vol Filter" agree with your analysis.
---
Settings Guide
Structure Settings:
- Pivot Lookback: Adjusts how sensitive the zones are (Default: 10/5).
- HTF Confirmation: Optional filter to only show traps that align with Higher Timeframe structure (e.g., 1H or 4H).
Quality Filters:
- RSI Divergence: Requires momentum to disagree with price (classic reversal sign).
- Volume Spike: Requires volume to be higher than average (Smart Money footprint).
Visuals:
- Clean Mode: A presenter-favorite feature. Hides all historical zones and leaves only the active setup—perfect for taking screenshots or sharing analysis.
Disclaimer
This tool is designed to assist with technical analysis and identifying potential areas of interest. It does not guarantee profits. Trading involves significant risk; always use proper risk management.

Flexible Marubozu Detector**Flexible Marubozu Detector (v6)**
This indicator identifies **Marubozu candles** — powerful candlestick patterns indicating strong directional momentum with minimal or no shadows (wicks).
A **Bullish Marubozu** (green) shows buyers dominated the session: open ≈ low, close ≈ high.
A **Bearish Marubozu** (red) shows sellers in control: open ≈ high, close ≈ low.
Unlike strict detectors, this version allows customizable tolerance for tiny shadows, making it practical for real markets where perfect Marubozu are rare.
**Key Features**
- **Adjustable tolerance**: Max shadow % of candle range (default 5%).
- **Minimum body size**: Requires body ≥ % of range (default 90%) to filter small candles.
- **Clear labels**: "BULL MARU" below bullish, "BEAR MARU" above bearish.
- **Alerts**: Built-in conditions for Bullish/Bearish Marubozu on any timeframe.
- **Pine Script v6**: Fully compatible with the latest version for optimal performance.
**How to Use**
1. Add to chart via Indicators > Community Scripts.
2. Customize inputs: Lower tolerance for stricter detection, higher for more signals.
3. Combine with trend tools (e.g., EMA, support/resistance) for better entries/exits.
- Bullish Marubozu in uptrend → potential continuation long.
- Bearish Marubozu in downtrend → potential short.
**Why Marubozu?**
These candles signal strong conviction and often precede continuations or reversals. This detector helps spot them quickly without manual scanning.
NOTE: I use this indicator along with "Swing high low support & resistance" by Pattersmart to trade reversals. I long trade a bearish Marubozu reversal, when the Marubozu breaks through a swing low identified on the "Swing high low support & resistance" indicator.
Open-source under Mozilla Public License 2.0. Feel free to modify!
If you find it useful, please like/boost/favorite! Feedback welcome.
© @toppermost

Wedge Green SquadWedge GS automatically detects confirmed swing highs and lows and draws clean wedge trendlines directly from the true pivot bars. The indicator uses non-repainting pivots and extends the lines forward to highlight contracting price structures, potential breakouts, and compression zones.
Designed for traders who value structure over noise, it works best on higher timeframes and pairs naturally with support, resistance, and volume analysis. This tool focuses on clarity and reliability, not prediction.
